有两个问题想请教
如图:1:左上角的位置能有配置项填满吗?
2、表头的时间间隔我现在写出来发现是自适应的,有办法配置成图上这样的时间间隔一样的表头吗

- 可以自己写扩展实现,例如下面的代码
(H => {
	H.Chart.prototype.callbacks.push(function (chart) {
		chart.fillHeader();
	});
	H.Chart.prototype.fillHeader = function () {
		let isExporting = this.options.chart.forExport,
			x = this.spacingBox.x,
			width = this.plotLeft - x,
			centerX = x + width / 2,
			y = this.spacingBox.y,
			height = this.plotTop - y,
			centerY = y + height / 2,
			headerRectAttr = {
				x: x,
				y: y,
				width: width,
				height: height,
				stroke: 'rgb(230, 230, 230)',
				'stroke-width': 1
			},
			xAxis = this.xAxis[this.xAxis.length - 1];
		if (this.headerRect) {
			this.headerRect.attr(headerRectAttr);
		} else {
			this.headerRect = this.renderer.rect().attr(headerRectAttr).add();
		}
		if (this.options.title._fixed) {
			return false;
		}
		let attr = this.title.alignAttr,
			diff = {
				x: centerX - attr.x,
				y: centerY - attr.y
			};
		this.options.title._fixed = true;
		this.options.title.x = diff.x;
		this.options.title.y = diff.y + this.options.title.margin;
	}
})(Highcharts);
注意事项:
- 需配置 title.floating = true
- 需在图表渲染完毕后添加 redraw 事件
Highcharts.addEvent(chart, 'redraw', () => {
	chart.afterRedraw();
});
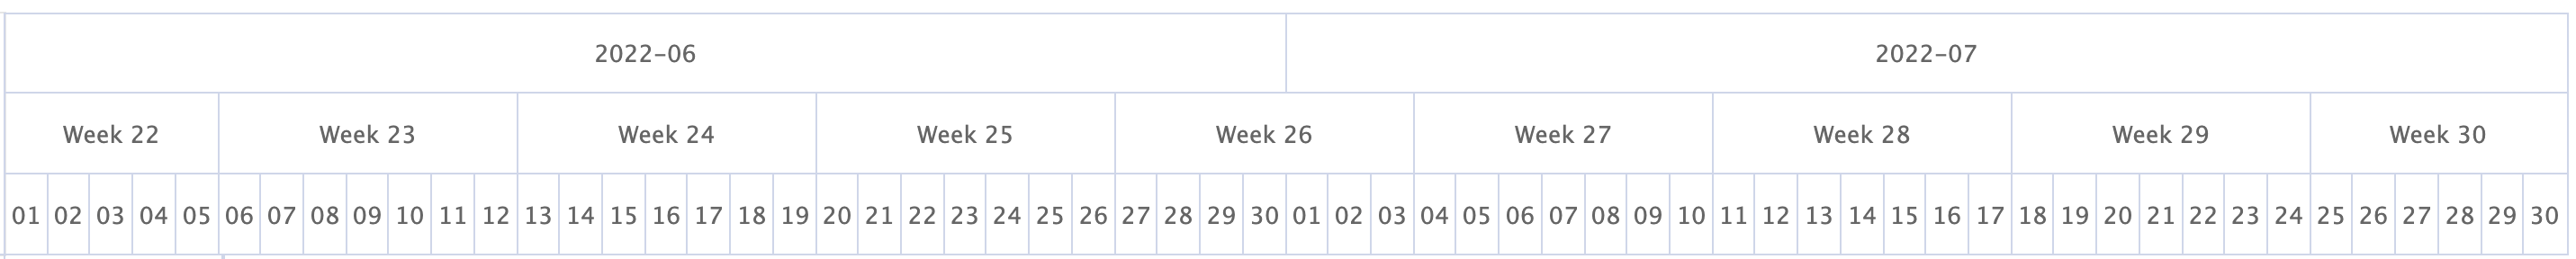
- 表头的间隔,其实就是 xAxis 的刻度间隔(tickInterval)
例如:
xAxis: [{
	min: start,
	max: end,
	tickInterval: day,
	labels: {
		formatter: function () {
			return Highcharts.dateFormat('%d', this.value);
		}
	}
}, {
	currentDateIndicator: true,
	min: start,
	max: end,
	tickInterval: 7 * day,
}, {
	min: start,
	end: end,
	tickInterval: 30 * day,
	labels: {
		formatter: function () {
			return Highcharts.dateFormat('%Y-%m', this.value);
		}
	}
}]
对应的效果