官网的这个tooltip联动的列子,用vue如何写
用events.mouseover获取tooltip的位置,再同步到其他图行吗
稍微改造一下代码,参考我改造后的代码:objective-montalcini-qckq2 - CodeSandbox
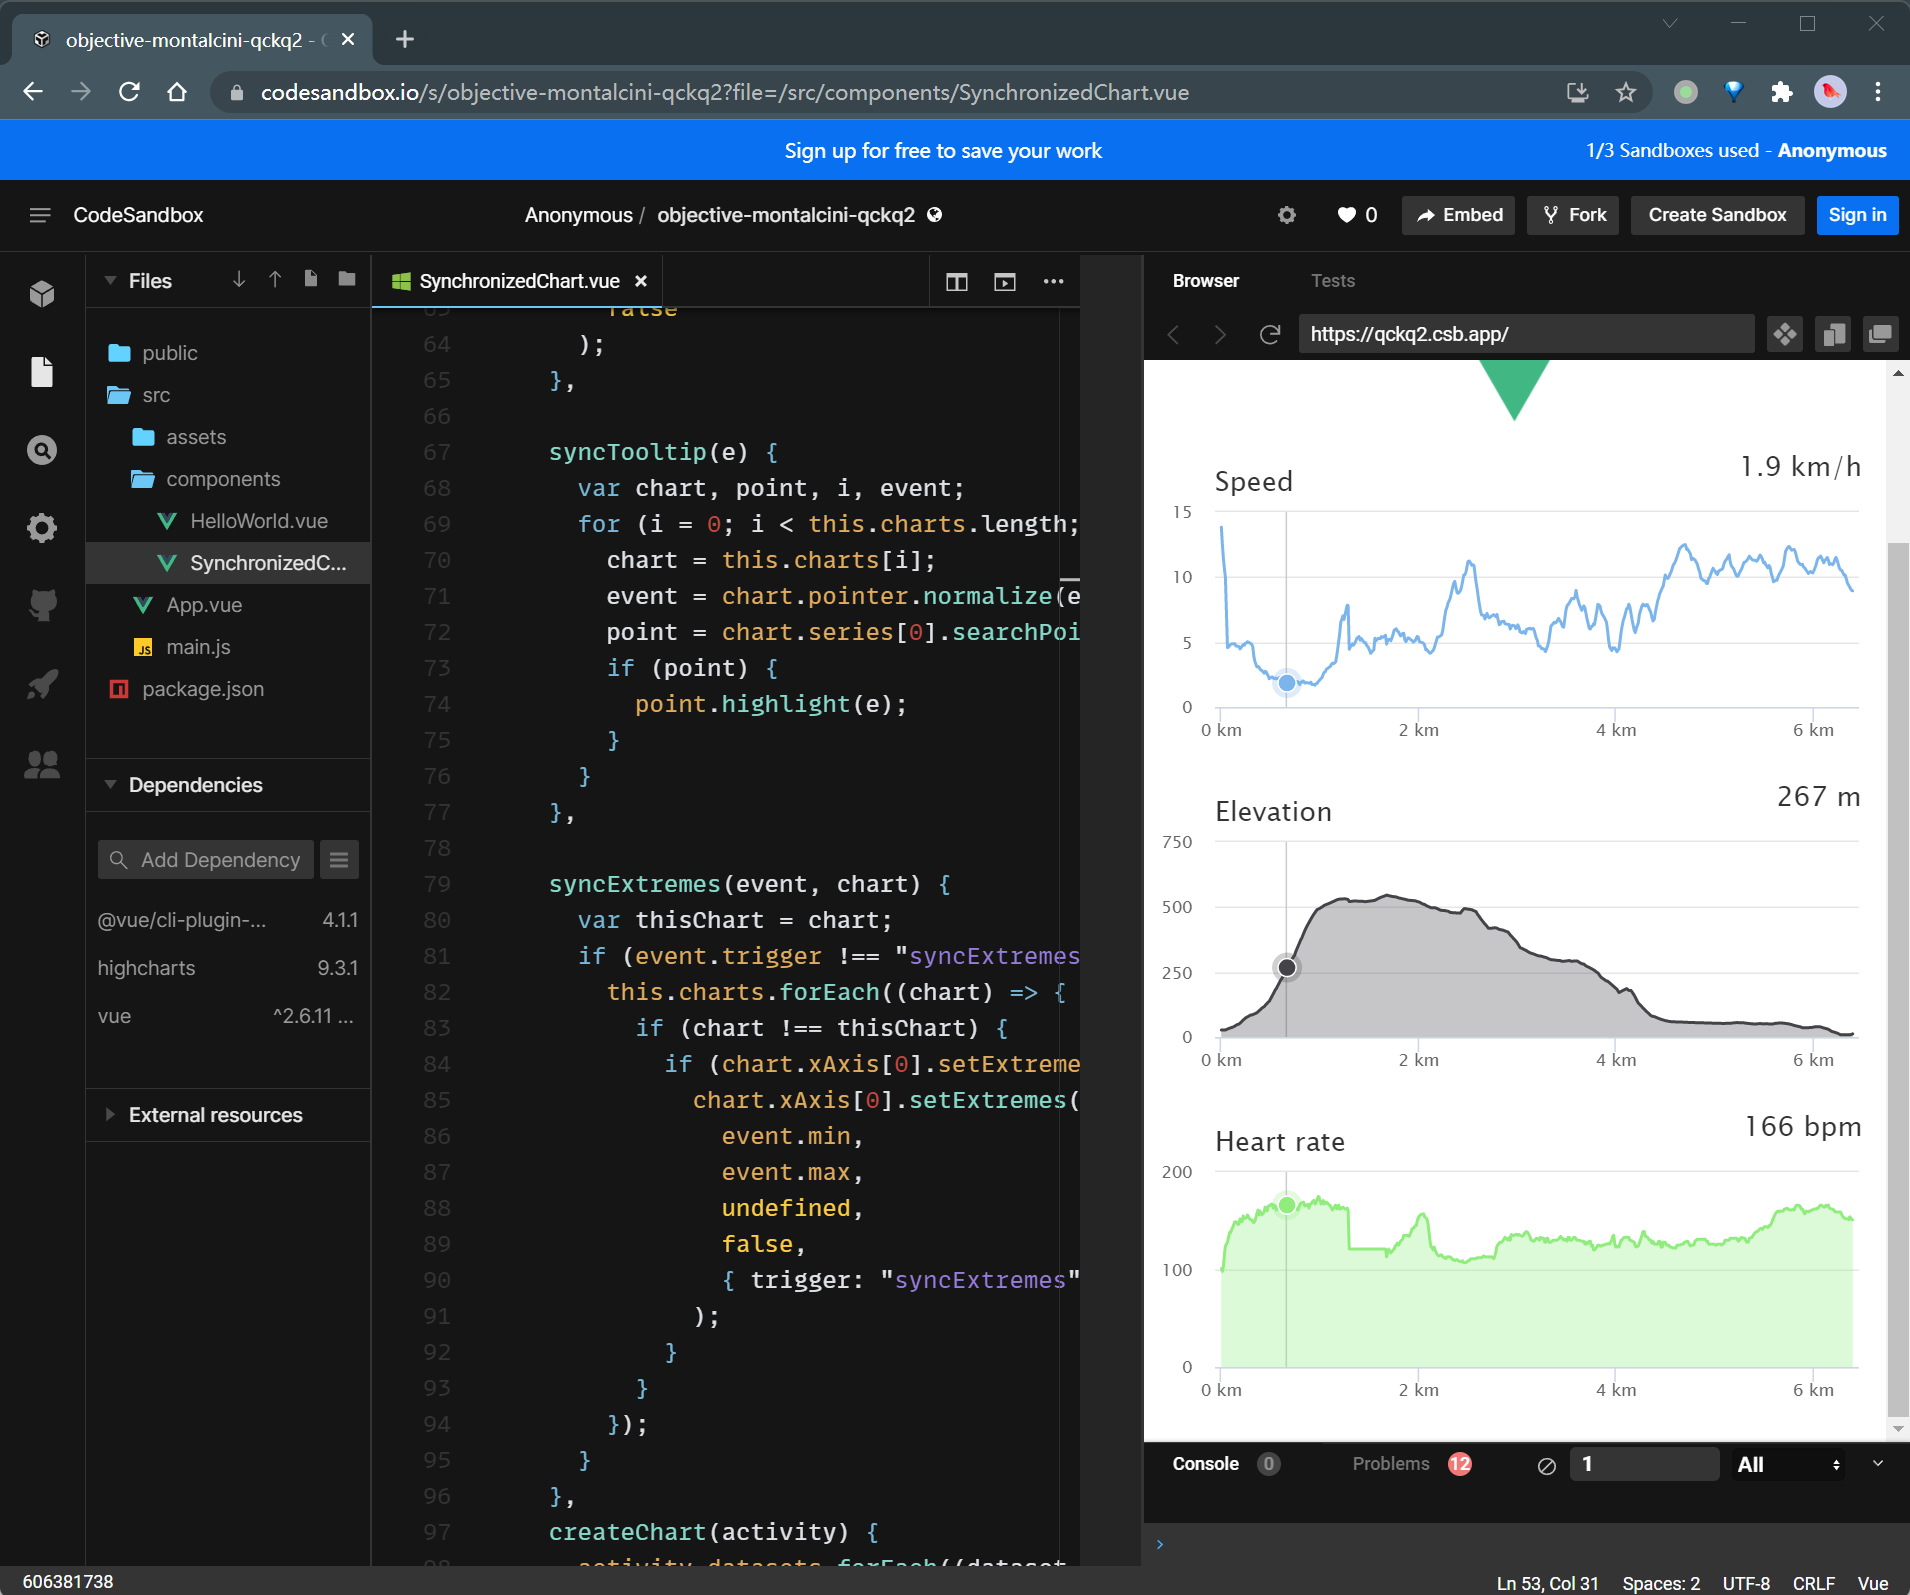
关键代码:
SynchronizedChart.vue (Vue component)
<template>
  <div class="container"></div>
</template>

<script>
import Highcharts from "highcharts";
export default {
  name: "SynchronizedChart",
  props: {
    msg: String,
  },
  data() {
    return {
      charts: [],
    };
  },
  mounted() {
    this.wrapHighcharts();
    fetch("/data.json")
      .then((response) => {
        return response.json();
      })
      .then((data) => {
        this.createChart(data);
        this.bindEvent();
      });
  },
  methods: {
    wrapHighcharts() {
      Highcharts.Pointer.prototype.reset = function () {
        return undefined;
      };
      /**
       * 高亮当前的数据点,并设置鼠标滑动状态及绘制十字准星线
       */
      Highcharts.Point.prototype.highlight = function (event) {
        this.onMouseOver(); // 显示鼠标激活标识
        this.series.chart.tooltip.refresh(this); // 显示提示框
        this.series.chart.xAxis[0].drawCrosshair(event, this); // 显示十字准星线
      };
    },
    bindEvent() {
      this.$el.addEventListener(
        "mousemove",
        (e) => {
          this.syncTooltip(e);
        },
        false
      );
      this.$el.addEventListener(
        "touchstart",
        (e) => {
          this.syncTooltip(e);
        },
        false
      );

      this.$el.addEventListener(
        "touchmove",
        (e) => {
          this.syncTooltip(e);
        },
        false
      );
    },

    syncTooltip(e) {
      var chart, point, i, event;
      for (i = 0; i < this.charts.length; i = i + 1) {
        chart = this.charts[i];
        event = chart.pointer.normalize(e); // Find coordinates within the chart
        point = chart.series[0].searchPoint(event, true); // Get the hovered point
        if (point) {
          point.highlight(e);
        }
      }
    },

    syncExtremes(event, chart) {
      var thisChart = chart;
      if (event.trigger !== "syncExtremes") {
        this.charts.forEach((chart) => {
          if (chart !== thisChart) {
            if (chart.xAxis[0].setExtremes) {
              chart.xAxis[0].setExtremes(
                event.min,
                event.max,
                undefined,
                false,
                { trigger: "syncExtremes" }
              );
            }
          }
        });
      }
    },
    createChart(activity) {
      activity.datasets.forEach((dataset, i) => {
        dataset.data = dataset.data.map(function (val, j) {
          return [activity.xData[j], val];
        });

        let container = document.createElement("div");
        container.className = "chart";
        this.$el.appendChild(container);

        let _this = this;

        this.charts.push(
          Highcharts.chart(container, {
            chart: {
              marginLeft: 40, // Keep all charts left aligned
              spacingTop: 20,
              spacingBottom: 20,
              zoomType: "x",
            },
            title: {
              text: dataset.name,
              align: "left",
              margin: 0,
              x: 30,
            },
            credits: {
              enabled: false,
            },
            legend: {
              enabled: false,
            },
            xAxis: {
              crosshair: true,
              events: {
                setExtremes: function (e) {
                  let chart = this;
                  _this.syncExtremes(e, chart);
                },
              },
              labels: {
                format: "{value} km",
              },
            },
            yAxis: {
              title: {
                text: null,
              },
            },
            tooltip: {
              positioner: function () {
                return {
                  x: this.chart.chartWidth - this.label.width, // right aligned
                  y: -1, // align to title
                };
              },
              borderWidth: 0,
              backgroundColor: "none",
              pointFormat: "{point.y}",
              headerFormat: "",
              shadow: false,
              style: {
                fontSize: "18px",
              },
              valueDecimals: dataset.valueDecimals,
            },
            series: [
              {
                data: dataset.data,
                name: dataset.name,
                type: dataset.type,
                color: Highcharts.getOptions().colors[i],
                fillOpacity: 0.3,
                tooltip: {
                  valueSuffix: " " + dataset.unit,
                },
              },
            ],
          })
        );
      });
    },
  },
};
</script>

<!-- Add "scoped" attribute to limit CSS to this component only -->
<style>
h3 {
  margin: 40px 0 0;
}
ul {
  list-style-type: none;
  padding: 0;
}
li {
  display: inline-block;
  margin: 0 10px;
}
a {
  color: #42b983;
}

.chart {
  min-width: 320px;
  max-width: 800px;
  height: 220px;
  margin: 0 auto;
}
</style>
可以用了,非常感谢
