使用导出服务器得到的pdf和本地Highchart 显示的不一样

Hello,
我遇到一个问题:
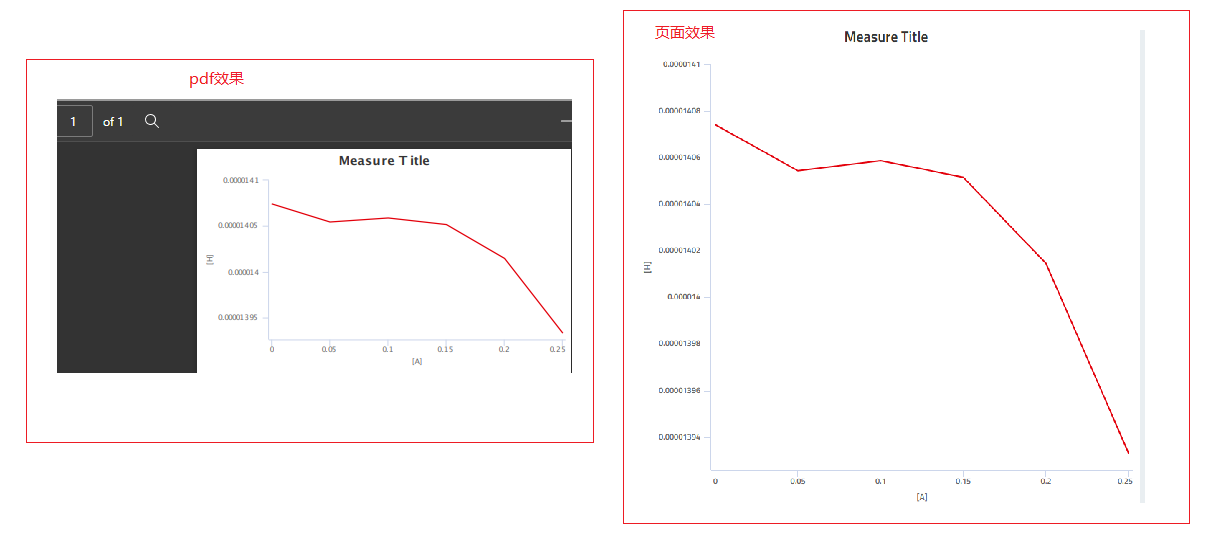
使用导出服务器得到的pdf 和 本地页面上的图不一样,生成pdf和页面的数据是完全一样的,希望能生成和页面效果一样的pdf.

得到的pdf和页面对比如下:

pdf生成方法:

  1. 访问下面链接
    Highcharts Export Server
  2. 把下面数据替换链接的Options区域
{
   "exporting":{
            "enabled":false
        },
        "legend":{
            "layout":"horizontal",
            "backgroundColor":"#FFFFFF",
            "align":"center",
            "verticalAlign":"bottom",
            "enabled":true
        },
        "title":{
            "text":"Measure Title",
            "style":{
                "fontWeight":"bold",
                "fontSize":"20px"
            }
        },
        "xAxis":{
            "title":{
                "text":" [A]"
            },
            "type":"linear",
            "lineWidth":1,
            "max":null,
            "min":null,
            "gridLineWidth":0,
            "minorTicks":true,
            "minorGridLineWidth":0,
            "tickInterval":null,
            "minorTickInterval":null,
            "startOnTick":false
        },
        "yAxis":{
            "title":{
                "text":" [H]"
            },
            "type":"linear",
            "lineWidth":1,
            "tickWidth":1,
            "max":null,
            "min":null,
            "gridLineWidth":0,
            "minorTicks":true,
            "minorGridLineWidth":0,
            "tickInterval":null,
            "minorTickInterval":null,
            "startOnTick":false
        },
        "series":[
            {
                "name":"new",
                "dashStyle":"Solid",
                "data":[
                    [
                        0,
                        0.000014074199999999998
                    ],
                    [
                        0.05,
                        0.000014054399999999999
                    ],
                    [
                        0.1,
                        0.0000140588
                    ],
                    [
                        0.15,
                        0.000014051600000000001
                    ],
                    [
                        0.2,
                        0.000014014600000000001
                    ],
                    [
                        0.25,
                        0.000013933
                    ]
                ],
                "zIndex":1,
                "marker":{
                    "enabled":false,
                    "symbol":"circle",
                    "radius":4,
                    "states":{
                        "hover":{
                            "enabled":true
                        }
                    }
                },
                "color":"#E3000B"
            }
        ],
        "credits":{
            "enabled":false
        } 
}

  1. Image file format 设置为 pdf
  2. Width设为300
  3. 点preview button

这是高度不一致导致的(不同高度 Y 轴刻度不一样),导出时指定和页面显示的大小一致即可,设置方法:

指定 exporting.sourceHeightexporting.sourceWidth

这里有说明:GitHub - highcharts/node-export-server: Highcharts Node.js export server

经测试OK.
非常感谢!

同时发现tickInterval 也必须设置,不然chart curve 会根据屏幕大小变化。