如何隐藏导出chart的按钮

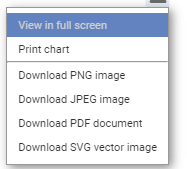
如何隐藏图表导出的按钮,我只需要导出JPEG,PDF,SVG其他的都不需要
image

请参考这个教程:图表导出模块概述 | Highcharts 使用教程

$(function () {
	var chart = Highcharts.chart('container', {
		title: {
			text: '外部调用导出'
		},
		credits: {
			enabled: false
		},
		xAxis: {
			categories: ['Jan', 'Feb', 'Mar', 'Apr', 'May', 'Jun', 'Jul', 'Aug', 'Sep', 'Oct', 'Nov', 'Dec']
		},
		exporting: {
			buttons:{
				contextButton:{
					menuItems:[
						{
							text:'下载PDF文件',
							onClick:function(){
								chart.exportChart({
									type:'application/pdf',
									filename: 'my-pdf'
								})
							}
						}
					]
				}
			},
			// enabled: true,
			chartOptions: { // specific options for the exported image
				plotOptions: {
					series: {
						dataLabels: {
							enabled: true
						}
					}
				}
			},
		},
		series: [{
			data: [29.9, 71.5, 106.4, 129.2, 144.0, 176.0, 135.6, 148.5, 216.4, 194.1, 95.6, 54.4]
		}],
	});
});

这是我的代码,为什么click执行后没有执行导出方法

注意大小写,onClick 应该是 onclick

感谢回复。
我自定义了节点卡片,并且使用了客户端导出,但是导出的文件不显示头像图片是为什么?如果用官方的导出服务器会正常显示头像

 const nodeFormatter = function (width, height) {
                    var outerStyle = {
                        width: '100%',
                        height: '100%',
                        display: 'flex',
                        'flex-direction': 'row',
                        'align-items': 'center',
                        'justify-content': 'center'
                    }, imageStyle = {
                        'max-height': '100%',
                        'border-radius': '50%'
                    }, innerStyle: any = {
                        width: '100%',
                        padding: 0,
                        'text-align': 'center',
                        'white-space': 'normal'
                    }, nameStyle = {
                        margin: 0
                    }, titleStyle = {
                        margin: 0
                    }, descriptionStyle = {
                        opacity: 0.75,
                        margin: '5px'
                    };


                    // eslint-disable-next-line valid-jsdoc
                    /**
                     * @private
                     */
                    function styleAttr(style) {
                        return Object.keys(style).reduce(function (str, key) {
                            return str + key + ':' + style[key] + ';';
                        }, 'style="') + '"';
                    }
                    if (this.point.image) {
                        imageStyle['max-width'] = '30%';
                        innerStyle.width = '70%';
                    }
                    // PhantomJS doesn't support flex, roll back to absolute
                    // positioning
                    if (this.series.chart.renderer.forExport) {
                        outerStyle.display = 'block';

                        innerStyle.position = 'absolute';
                        innerStyle.left = this.point.image ? '30%' : 0;
                        innerStyle.top = 0;

                        // 修改的地方1
                        let offset = (width - height * 0.3) / 2 + 'px';
                        outerStyle['padding-top'] = offset;
                        innerStyle.top = offset;

                    }
                    var html = '<div ' + styleAttr(outerStyle) + '>';
                    if (this.point.image) {
                        console.log(this.point.image)
                        html += '<img src="' + this.point.image + '" ' +
                            styleAttr(imageStyle) + '>';
                    }
                    html += '<div ' + styleAttr(innerStyle) + '>';
                    if (this.point.name) {
                        html += '<h4 ' + styleAttr(nameStyle) + '>' +
                            this.point.name + '</h4>';
                    }
                    if (this.point.title) {
                        html += '<p ' + styleAttr(titleStyle) + '>' +
                            (this.point.title || '') + '</p>';
                    }
                    if (this.point.description) {
                        html += '<p ' + styleAttr(descriptionStyle) + '>' +
                            this.point.description + '</p>';
                    }
                    html += '</div>' +
                        '</div>';
                    return html;
                }

                res.nodes.forEach(item => {
                    item.parentId = item.pid
                })
                let series: any = {
                    type: 'organization',
                    nodeWidth: 100, // 高度
                    nodeHeight: 180, // 宽度
                    color: '#fff',
                    zoom: true,
                    colorByPoint: false,
                    nodes: res.nodes,
                    dataLabels: {
                        nodeFormatter: function () {
                            return nodeFormatter.call(this, 100, 180)
                        }
                    }
                }
                this.chart = (Highcharts as any).chart(this.el.nativeElement.querySelector('.chartContainer'), {

                    title: {
                        text:"&nbsp;&nbsp;&nbsp;"+localStorage.getItem('projectName')+"&nbsp;&nbsp;&nbsp;"
                    },
                    exporting: {
                        buttons:{
                            contextButton:{
                                menuItems:[
                                    {
                                        text:'下载PDF文件',
                                        onclick:function(){
                                            this.exportChart({
                                                type:'application/pdf',
                                                filename: 'my-pdf'
                                            })
                                        }
                                    }
                                ]
                            }
                        },
                        // enabled: true,
                        chartOptions: { // specific options for the exported image
                            plotOptions: {
                                series: {
                                    dataLabels: {
                                        enabled: true
                                    }
                                }
                            }
                        },
                    },
                    credits: {
                        enabled: false
                    },
                    chart: {
                        // spacingTop: 40,
                        backgroundColor: '#fff',
                        "zoomType": "x",
                        "inverted": true,
                        // height: 401,
                        // width: 930,
                    },
                    tooltip: {
                        outside: true,
                        enabled: false
                    },
                    series: [series],
                    navigation: {
                        buttonOptions: {
                            enabled: true,

                            // y: -25
                        }
                    }
                })